IT Insights Lab — IT Community of Uzbekistan

Community-driven data analytics

IT Insights Lab

The lab analyses real data, builds interactive dashboards and runs research on community challenges. All of it is done by data volunteers in Uzbekistan.

First study

133 responses

Every square is one answer from the IT Community events survey, collected and analysed by the lab.

Focus

Data analytics and open research

Team

8 data volunteers

Outputs

Research, dashboard, report, data explorer

Home

itcomlab.uz

Mission

Built on three core pillars

Everything the lab does comes back to data quality, collaboration inside the community and the growth of local talent.

Practical data projects

Real, locally sourced datasets turned into interactive dashboards and analytical tools that create tangible value for communities across Uzbekistan.

Real datasets and dashboards

Collaborative research

Volunteer researchers publish reports on economics, education, transportation and more, all of it open and freely accessible.

Insightful reports and open data

Volunteer growth

Analysts, engineers and researchers are mentored inside the lab, building an ecosystem of data professionals in the country.

Empowering local data talent

The work

Featured projects and dashboards

The first study looks at IT Community events: the research itself, the dashboard built on the dataset, the full report and a live explorer.

Completed research 133 responses

How can IT Community improve events and increase participant engagement?

Survey research on participant behaviour, satisfaction, motivations and barriers, aimed at improving the quality of community events.

  • Survey research
  • Community insights
  • Recommendations
View research
Dashboard 133 responses

IT Community Engagement Dashboard

An interactive summary of participation trends, satisfaction levels, motivations and barriers across the whole dataset.

  • KPI tracking
  • Participation trends
  • Satisfaction
Explore dashboard
Report Research complete

Full research report

Key findings, evidence-based recommendations and practical actions for strengthening IT Community events.

  • Findings
  • Recommendations
  • Executive summary
Read report
Dashboard Live explorer

Interactive data explorer

Filter and compare responses by role, attendance patterns, format preferences and engagement drivers to reach targeted insights.

  • Segmentation
  • Comparisons
  • Interactive analysis
Explore data

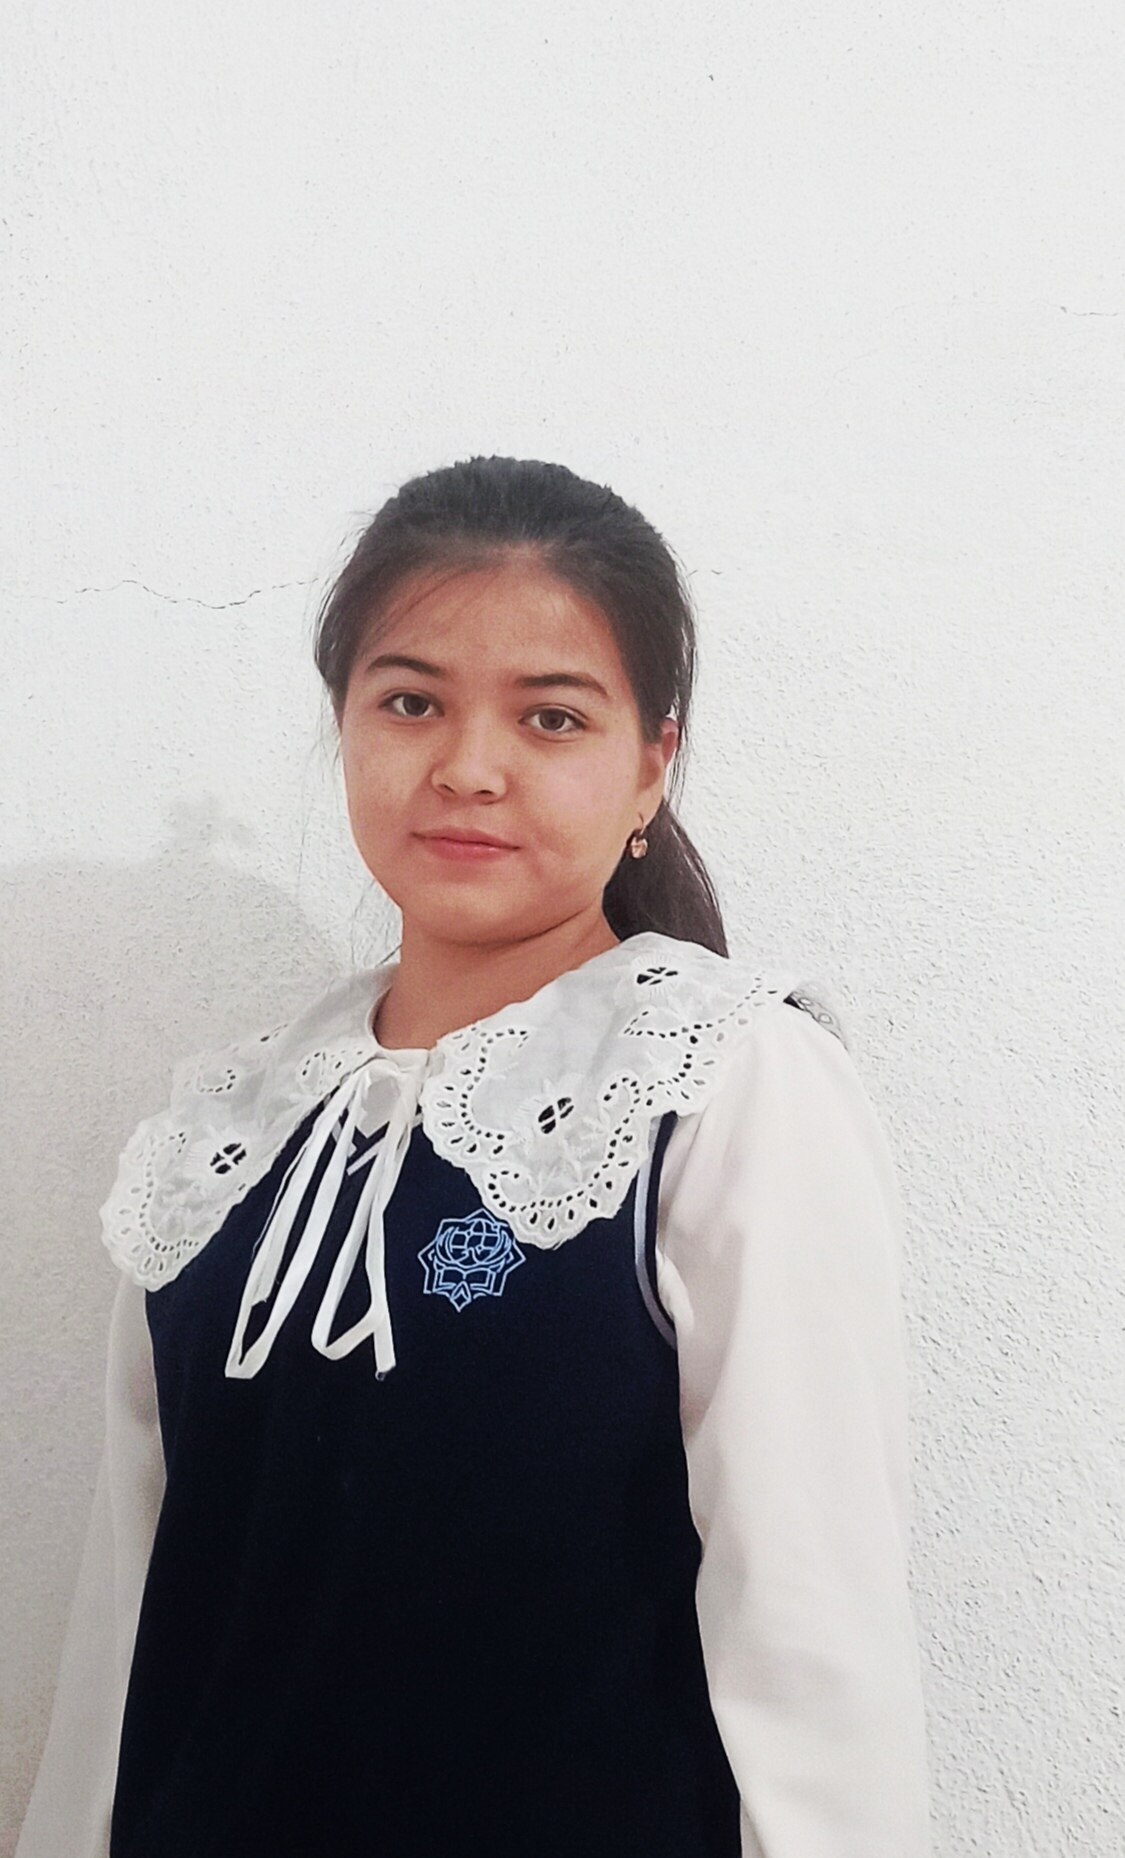
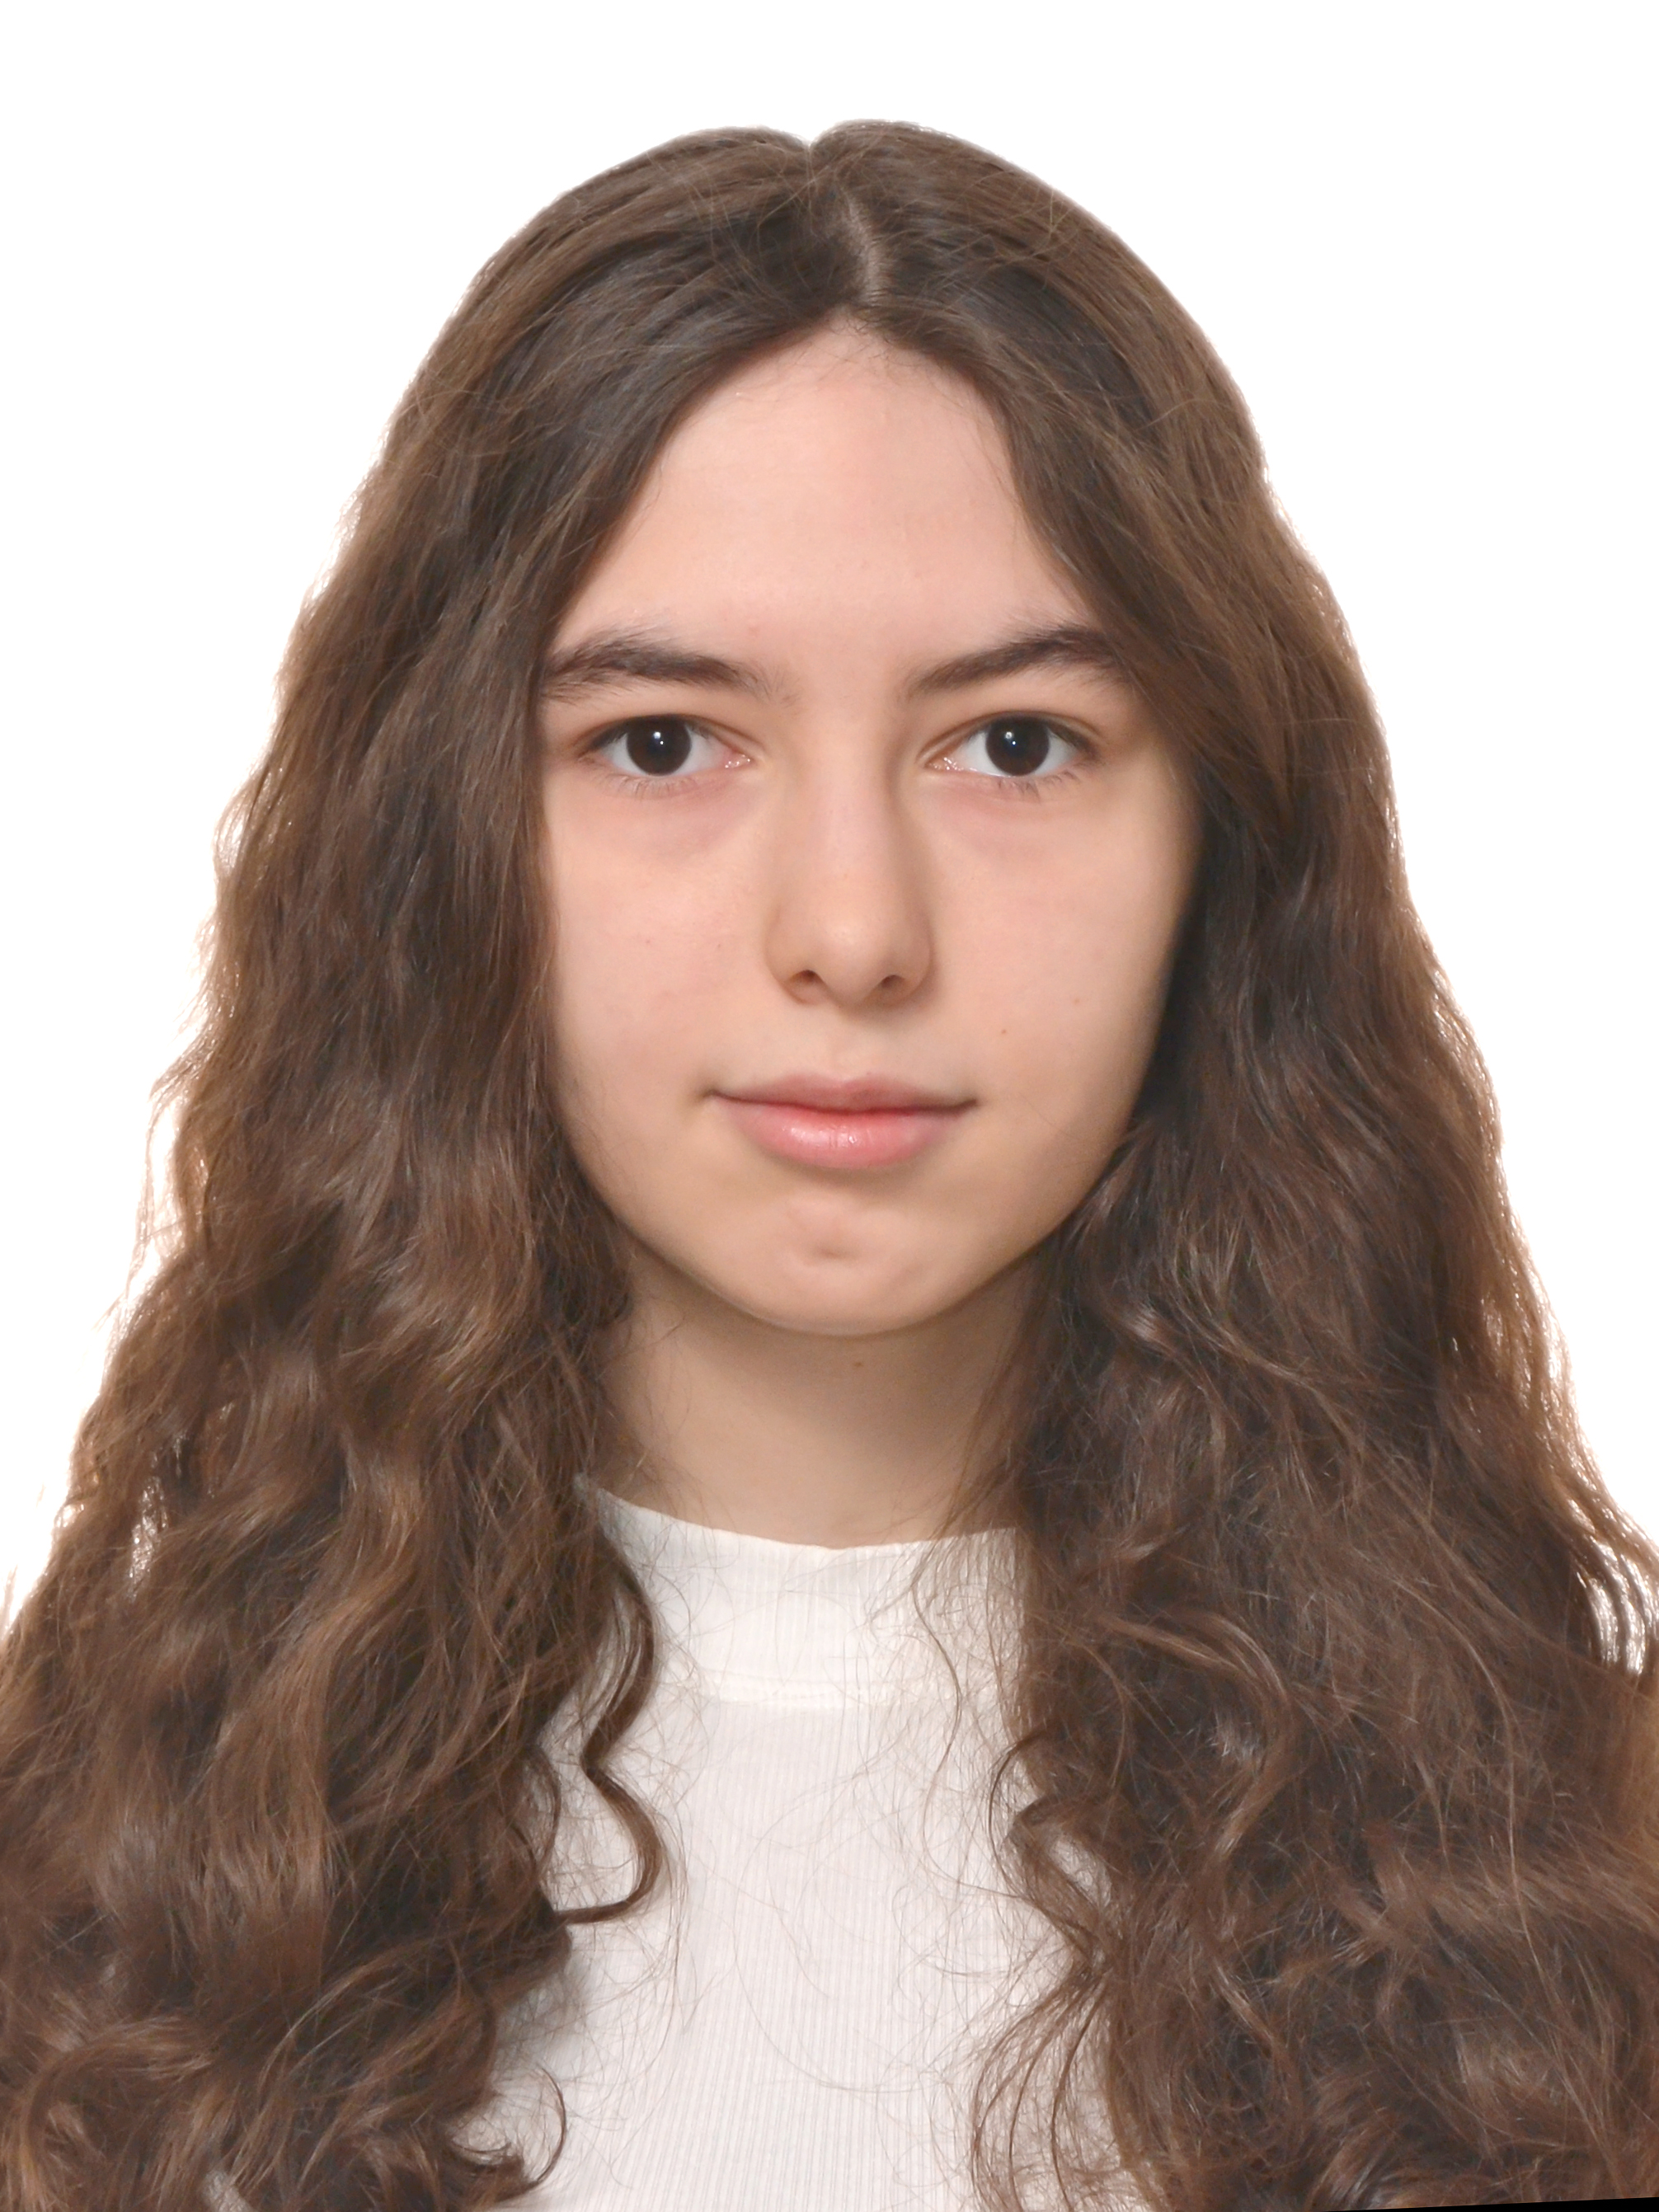
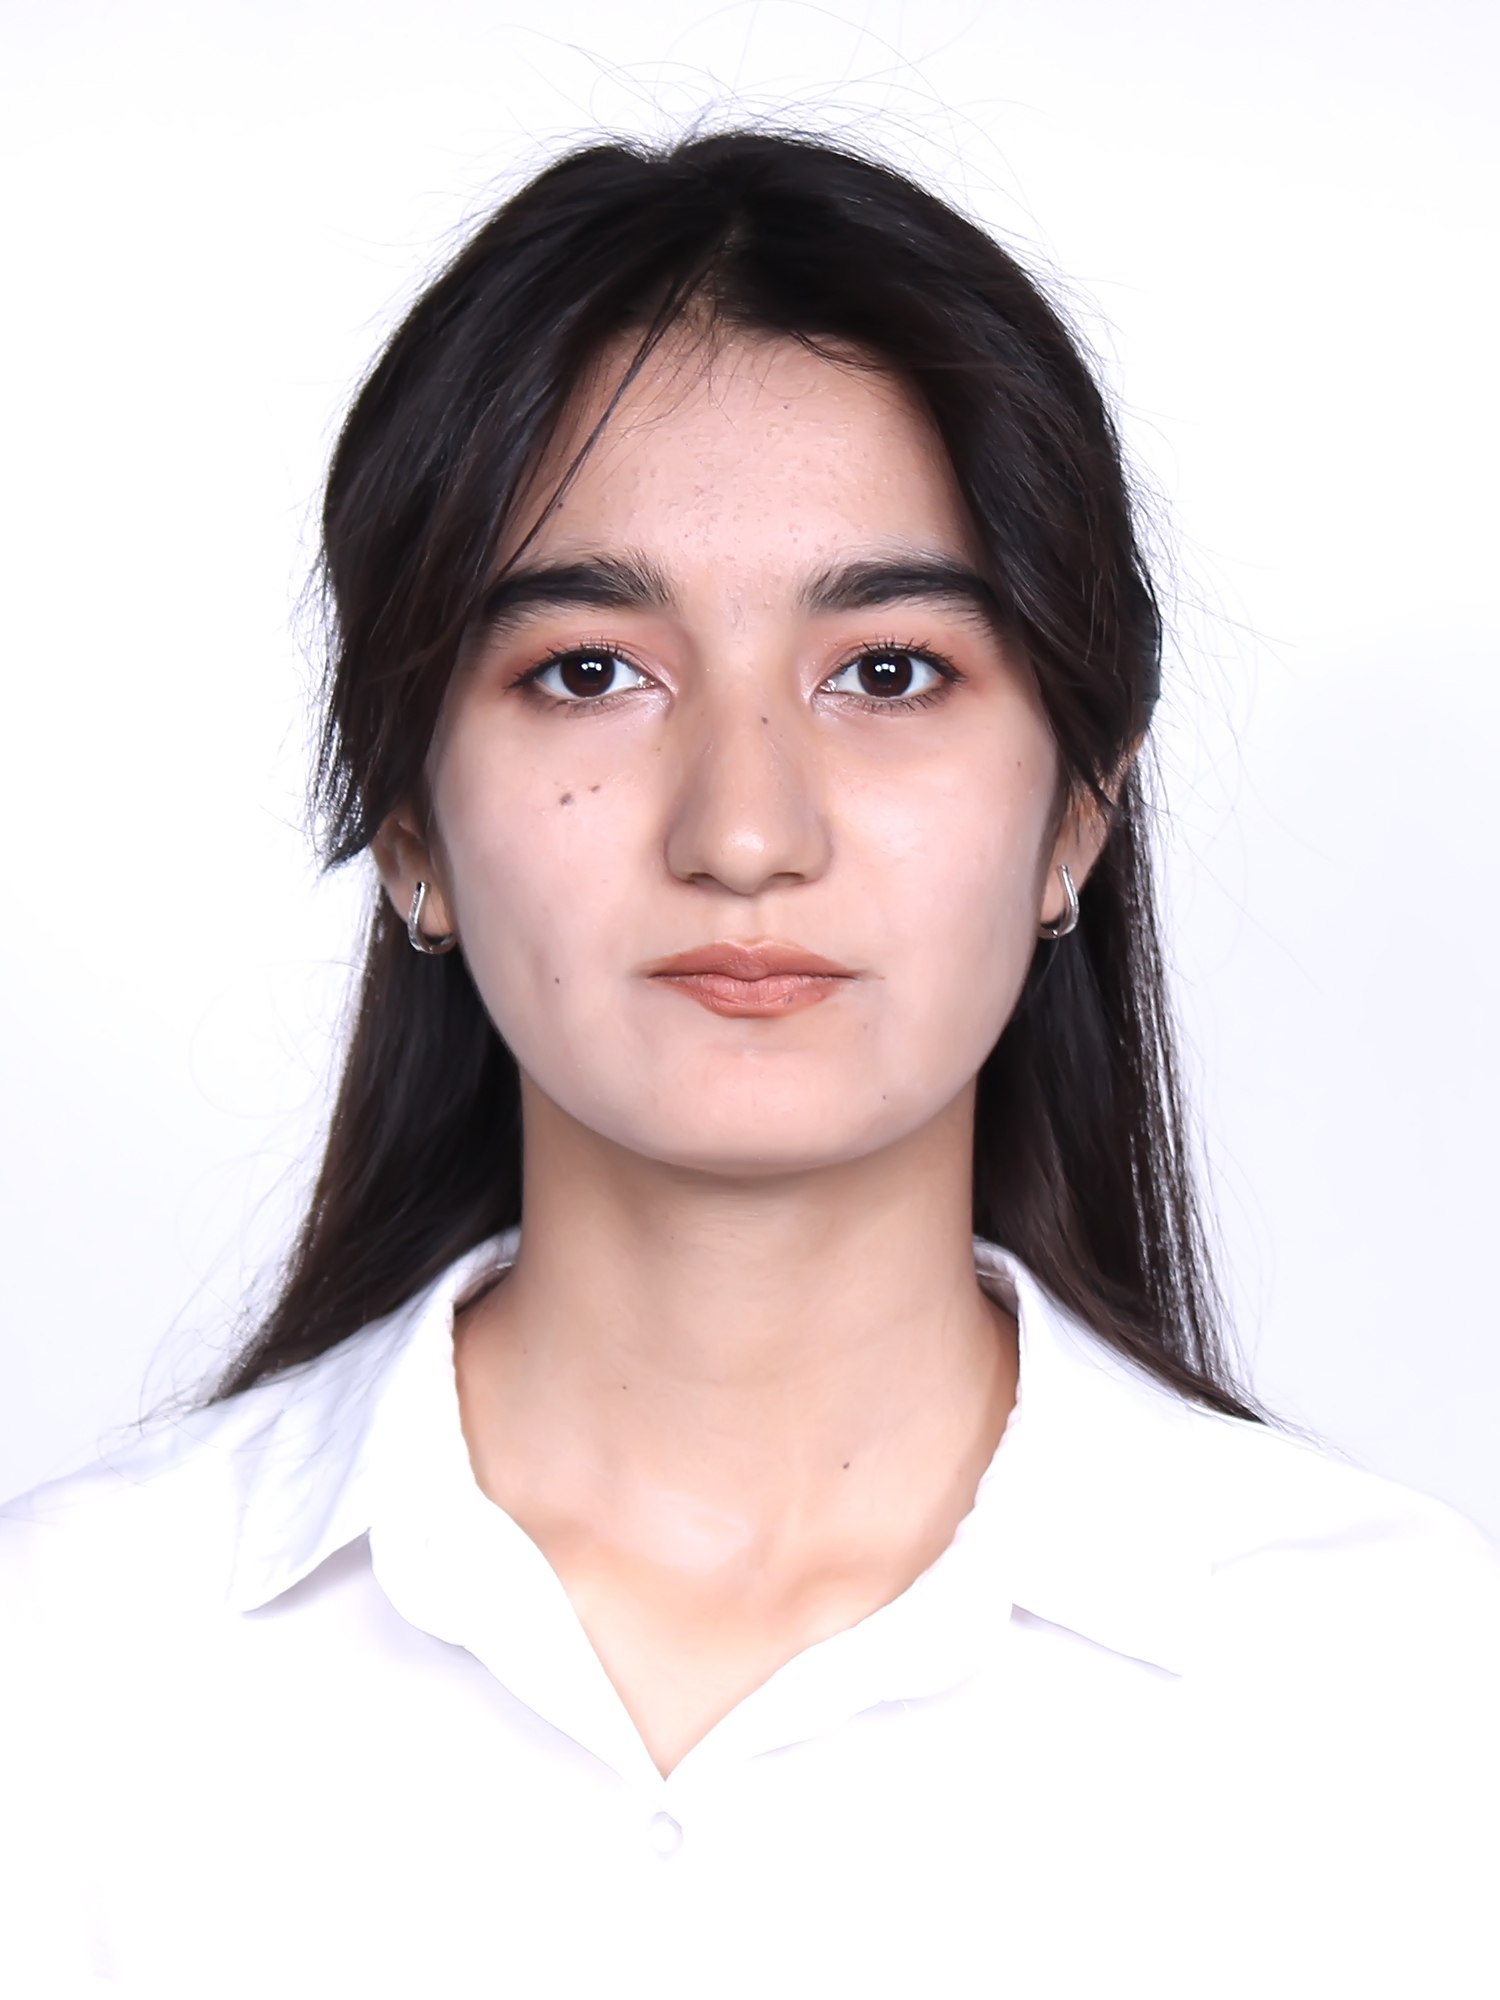
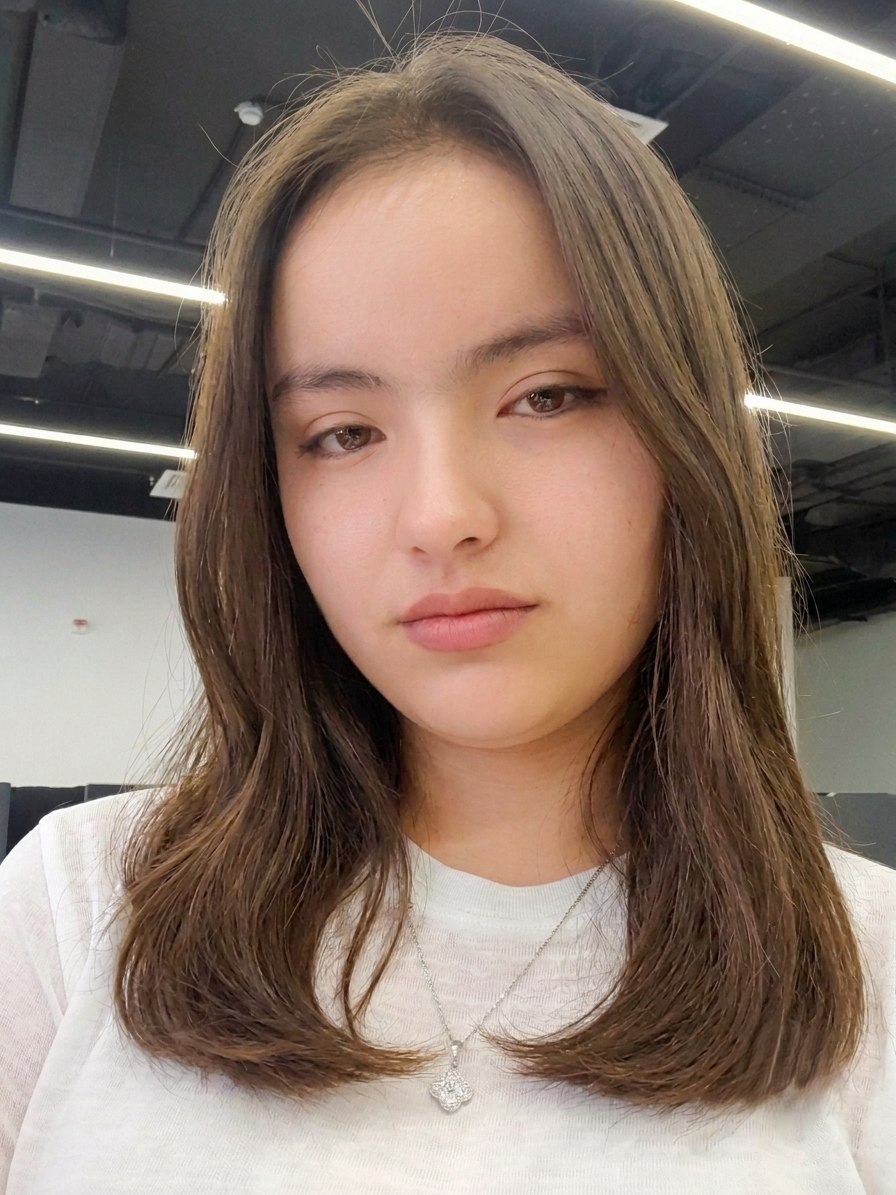
The team

Meet the data volunteers

Analysts, engineers, designers and researchers working together on data projects that matter.

Jansulu Atabekova

Jansulu Atabekova

Community and team lead

Directs team vision, community outreach and project operations for the lab.

LinkedIn
Abdulatif Botirsherov

Abdulatif Botirsherov

Data collection lead

Leads data collection strategy, survey design and field data acquisition.

LinkedIn
Dinora Madaminova

Dinora Madaminova

Visual lead

Works on data visualisation, UI and UX design, and dashboard experience.

LinkedIn
Jasmina Abakumova

Jasmina Abakumova

Data analyst

Handles exploratory analysis, data cleaning and statistical insights from survey metrics.

LinkedIn
Nafisa G'anijonova

Nafisa G'anijonova

Reports lead

Oversees research reporting, documentation synthesis and publication of insights.

LinkedIn
Rayxon Irisqulova

Rayxon Irisqulova

Data analyst

Focuses on quantitative analytics, response modelling and community data aggregation.

LinkedIn
Shoxistaxon Iriskulova

Shoxistaxon Iriskulova

Research lead

Drives research methodology, analytics frameworks and qualitative survey analysis.

LinkedIn
Khudoyorxon Askarov

Khudoyorxon Askarov

Reports lead

Builds interactive Power BI reports, automated data pipelines and analytical summaries.

LinkedIn
Impact

Numbers that tell the story

Real metrics from the community work so far.

1

Research project

A focused community study driving the work forward

8

Team members

Researchers, analysts, engineers and designers

133

Survey responses

Community feedback collected and analysed at scale

1

Interactive dashboard

A live interface built to make insights easy to explore

5

Recommendations

Actionable next steps grounded in the findings

The lab is open to new data volunteers

Beginner or senior, there is a place to work: analysis, engineering, BI, GIS, research or development. Questions go to the lab manager in Telegram.